

CONTRIBUTORS

Jonathan Curtis
Portfolio Manager
Franklin Equity

Matt Cioppa, CFA
VP/Portfolio Manager and Research Analyst
Franklin Equity Group
United States
The information technology (IT) sector had an eventful 2023, with underpinnings that we believe set it up well for another year of potentially strong performance in 2024. Four key factors that we believe can drive returns for the sector: (1) an inflection in revenue and earnings growth after several quarters of pandemic-era demand digestion; (2) resilient secular demand for digital transformation and the “application” phase of generative AI; (3) a more stable inflation and interest rate environment; and (4) reasonable valuations on a growth-relative basis.
Sector growth poised to outperform the broader market
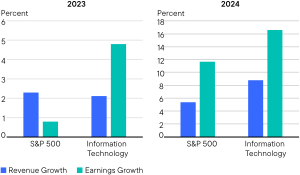
We’ve seen the IT sector become more disciplined and profitable over the past year as the cost of capital increased and growth decelerated following outsized COVID-era demand. After this period of IT budget-cutting, we believe businesses need to reinvest or risk falling behind on their digitization initiatives. We’ve been closely tracking signals that suggest this period of rationalization is shifting to one of stabilization, and we think a reacceleration in 2024 is the likely next step. This is reflected in current market estimates for sector revenue growth rates well above the broader market (S&P 500 Index). Disciplined expense management is expected to contribute to significant earnings leverage for the sector, potentially leading to double-digit earnings growth substantially ahead of the market [Exhibit 1].
Exhibit 1: 2024: Reaching an Inflection in Growth
S&P 500 Sector Earnings and Revenue Growth Rate Estimates (2023 and 2024)
Source: FactSet Earnings Insight, as of November 30, 2023. There is no assurance any forecast, projection or estimate will be realized. Indexes are unmanaged and one cannot directly invest in them. They do not include fees, expenses or sales charges. Past performance is not an indicator or a guarantee of future results.
Resilient demand for digital transformation and AI
Our confidence in above-market growth for the technology sector is bolstered by our assessment of strong demand for generative AI applications, which we believe will edge into the “application” stage for enterprise businesses in 2024. We’re currently in the “buildout and experimentation” phase—a period of high research and development intensity and capital expenditure which benefited semiconductor, hardware and cloud-computing companies in 2023, including several of the so-called “Magnificent Seven” (Alphabet, Amazon, Apple, Meta, Microsoft, NVIDIA and Tesla).
We’re now seeing businesses investing in the infrastructure and tools necessary to make better use of their vast amounts of proprietary data. This data can also be used in combination with generative AI models to dramatically improve productivity and the customer experience. In the application stage, we’ll see more use cases emerge, and more technology companies deploying generative AI to increase the value of their product or service. In this transition, we expect to see more beneficiaries further down the market-capitalization spectrum, particularly in industries like software and internet services.
A more stable interest-rate environment
Inflation appears to be easing in the United States and several other key geographies, with recent US Consumer Price Index data particularly encouraging. In November, the US Federal Reserve (Fed) once again chose to pause, rather than increase, interest rates. We believe these signs of disinflation are encouraging. For the higher-growth technology sector, stable or declining yields are generally supportive of valuation, and as we look to 2024, we continue to assume a stable yield environment.
Reasonable growth-relative valuation
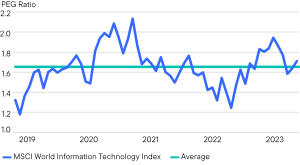
While the 2023 rally brought an increase in sector valuation multiples, we’d note that this multiple expansion was concentrated in the mega-cap companies, and that it generally coincided with improving forward earnings expectations as the year progressed. When looking at the PEG ratio (price to earnings relative to growth) of the MSCI World Information Technology Index [Exhibit 2], we’d highlight that the current PEG stands just slightly above the five-year average. In other words, despite the strong performance in the sector year-to-date, we don’t believe investors are currently paying excessively for the sector’s attractive secular growth and quality characteristics.
Exhibit 2: A Harmonic Convergence of Price, Growth and Valuation in IT
MSCI World Information Technology Index Price-to-Earnings-to-Growth (PEG) Ratio
Five years ended November 30, 2023
Source: Factset, as of November 30, 2023. The MSCI World Information Technology Index is designed to capture the large- and mid-cap segments across 23 developed markets countries. All securities in the index are classified in the Information Technology sector as per the Global Industry Classification Standard (GICS®). Indexes are unmanaged and one cannot directly invest in them. They do not include fees, expenses or sales charges. Past performance is not an indicator or a guarantee of future results.
WHAT ARE THE RISKS?
All investments involve risks, including possible loss of principal.
Equity securities are subject to price fluctuation and possible loss of principal.
Active management does not ensure gains or protect against market declines.
Investment strategies which incorporate the identification of thematic investment opportunities, and their performance, may be negatively impacted if the investment manager does not correctly identify such opportunities or if the theme develops in an unexpected manner.
Focusing investments in technology and information technology-related industries carries much greater risks of adverse developments and price movements in such industries than a strategy that invests in a wider variety of industries.
To the extent a strategy focuses on particular countries, regions, industries, sectors or types of investment from time to time, it may be subject to greater risks of adverse developments in such areas of focus than a strategy that invests in a wider variety of countries, regions, industries, sectors or investments.
Digital assets are subject to risks relating to immature and rapidly developing technology, security vulnerabilities of this technology, (such as theft, loss, or destruction of cryptographic keys), conflicting intellectual property claims, credit risk of digital asset exchanges, regulatory uncertainty, high volatility in their value/price, unclear acceptance by users and global marketplaces, and manipulation or fraud. Portfolio managers, service providers to the portfolios and other market participants increasingly depend on complex information technology and communications systems to conduct business functions. These systems are subject to a number of different threats or risks that could adversely affect the portfolio and their investors, despite the efforts of the portfolio managers and service providers to adopt technologies, processes and practices intended to mitigate these risks and protect the security of their computer systems, software, networks and other technology assets, as well as the confidentiality, integrity and availability of information belonging to the portfolios and their investors.