

CONTRIBUTORS

Lauren DeMore, CFA
Portfolio Manager

Darren Jaroch, CFA
Portfolio Manager
When evaluating businesses for our portfolios, a key goal is determining a company’s value to its shareholders. There are many ways to measure this, such as the distribution of excess profits to shareholders in the form of dividends. Dividends can offer investors a sense of near-term dependability, and may be viewed as more reliable than gains in stock prices.
Many companies commit to paying a quarterly dividend and work hard to follow through on the commitment. However, sometimes businesses aim too high with their dividends. Discerning whether a dividend is solid—or might even grow—takes skill and research. It also helps avoid disappointments, as businesses can cut or suspend their dividends at will.
In fact, companies intending to pay the highest dividends tend to be more prone to disappointment. If you rank large companies by their dividend plans, you find that the firms in the top 10% tend to have the highest share of letdowns.1 In our view, it’s better to focus on companies that are positioned to increase their dividends.
Why we focus on income growers
The success of our investment strategy is not as simple as finding the highest dividend yields. We tend to favor companies that are income growers. We evaluate dividends in the framework of a company’s overall financial picture, including how its executive leadership stewards company cash. While paying out dividends might make sense for some firms, we also look for those that are deploying cash in ways that could lead to stronger earnings growth or dividend distributions in the future. A business that has dividend upside, in our view, is managing itself for further growth and is thinking creatively about ways to add shareholder value.

We believe focusing on income growers helps us identify businesses with more robust growth profiles. Companies with the ability to grow income, in many cases, also successfully grow earnings and revenue. Stocks with these qualities, in our view, are more resilient when value is out of favor and growth leads markets.
Income Growers Had Better Growth Characteristics than Dividend Yielders
Average Income, Earnings, and Revenue Growth, 1990–2024
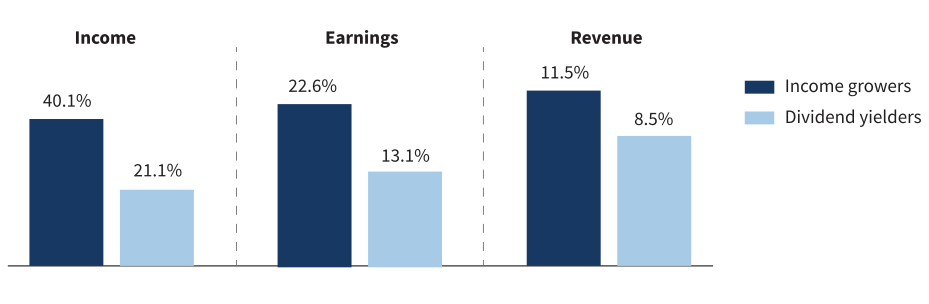
Source: Putnam. Income growers are stocks in the Russell 1000 Index that rank in the top 50% for five-year total income growth and profitability and that pay annual dividends above a rate of 0.25%. The dividend yielders are stocks in the Russell 1000 Index that rank in the top 25% for dividend yield. Income growth includes both dividends and stock buybacks. Indexes are unmanaged and one cannot directly invest in them. They do not include fees, expenses or sales charges. Past performance is not an indicator or a guarantee of future results.
Share buybacks: Another sign of shareholder value
Companies reward shareholders in many ways besides dividends. Share repurchases are an example. Repurchases have the effect of lifting income per share. In fact, repeated rounds of buybacks can mean increasing dividend income for shareholders, even if a company continues to pay out the same amount in dividends. Such companies can become income growers.
Since the 1990s, companies have increasingly rewarded shareholders more by repurchasing shares than paying larger dividends. Among large companies in the Russell 1000 Index, dividend yields have declined, but total yields—dividends plus stock repurchases—have increased.
Share Buybacks Have Helped Lift Total Yield Relative to Dividends
Average Yields for Companies in the Russell 1000 Index
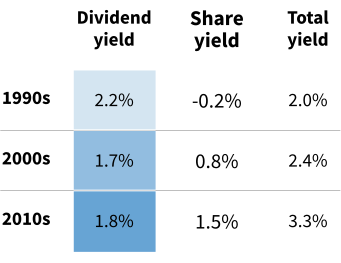
Source: Putnam. Share yield is the net issuance—purchase of shares in a year divided by the shares outstanding at the start of the year. A negative value means the company is issuing shares and thus causing earnings per share to decrease. A positive value results from buying back shares and increasing the earnings available per share.
As value investors, we also seek companies that are undergoing substantial positive internal or external change. With this research, we look beyond traditional value metrics to find opportunities across the value universe. For example, we have flexibility to measure value in ways that are sector-specific and even company-specific. We use different valuation methodologies based on each company’s industry or business model.
Endnotes
- Source: Putnam research. Based on analysis of dividend-paying companies in the Russell 1000 Index and their indicated dividend yields, 1990–2021.
WHAT ARE THE RISKS?
All investments involve risks, including possible loss of principal.
Equity securities are subject to price fluctuation and possible loss of principal. Large-capitalization companies may fall out of favor with investors based on market and economic conditions.
