

CONTRIBUTORS

Chris Clark
Chief Executive Officer, Co-Chief Investment Officer & President, RFS
February began with the markets swooning from President Trump’s announcement of tariffs on goods coming into the Unites States from China, Canada, and Mexico. From our vantage point as small-cap specialists, we think it is too early to gauge even the short-term impact on earnings and business fundamentals—both positive and negative—as the duration and impact of these tariffs is impossible to quantify. To take one example, February 3 began with the president announcing the immediate levying of tariffs on some of the United States’s most important trading partners. Markets quickly fell into disarray before some measure of calm returned following reports that there would be a pause on tariffs for goods coming from Mexico following constructive negotiations. Later that day, a similar arrangement was reached with Canada.
In addition, early indications are that tariffs—at least those involving Canada and Mexico—are more focused on trying to solve non-economic issues such as the cross-border drug trade and immigration, so they may be short lived, assuming that the ostensible goals are met. As of this writing, the greatest areas of potential impact, if these tariffs are sustained, would be on the housing, auto, and farm sectors of the US economy.
Our base case is that these tariffs are being used tactically and, while disruptive, will impact market sentiment, volatility, and risk taking more than longer-term business fundamentals. Regardless of their ultimate duration and scale, however, tariffs will hasten the now established trends of deglobalization, business reshoring to the United States, and better supply chain management in US manufacturing. All of which support our well-documented case for US small-cap stocks regaining leadership in the market, driven by a meaningful upswing in small-cap earnings and supported by valuations far more attractive than found in other market capitalization or style segments. We’ll have more to say on the issues of valuations, earnings, and volatility in two weeks’ time.
We think it’s important, however, to discuss volatility as we believe we are entering a period of heightened uncertainty driven by the disruptive nature of both the rhetoric and policy proposals of the new Trump administration. We have often talked about how we welcome short-term volatility as a foundational element for building long-term, market-beating returns. One critical advantage of having been small-cap investors for more than five decades is how it’s bred a deep appreciation for the cyclical nature of markets and the long-term benefit of contrarian thinking. Bull markets, bear markets, and long periods of outperformance for one style or asset class—all are subject to cyclical dynamics, and none lasts forever. Understanding what drives inflection points and a willingness to think critically beyond the market's conventional wisdom are the underpinnings for generating long-term outperformance.
While still in the early days, many signals point to the likelihood that equities will experience heightened levels of volatility as we move further into 2025 and, if history is our guide, this bodes well for small cap's relative returns. Looking at subsequent average annualized returns for the Russell 2000 and the large-cap Russell 1000 following periods when the CBOE S&P 500 Volatility Index—aka the VIX or the “fear gauge,”—was elevated showed a positive edge for small-cap stocks. Our research revealed that the percentage of periods when the Russell 2000 had better average annualized three-year returns than the Russell 1000 were at their highest following periods of heightened volatility.
Russell 2000 vs Russell 1000 Monthly Rolling VIX Regimes
Subsequent Average 1-Year Return Periods After VIX 1-Month Average was ≥ 28% from 12/31/89 through 12/31/24
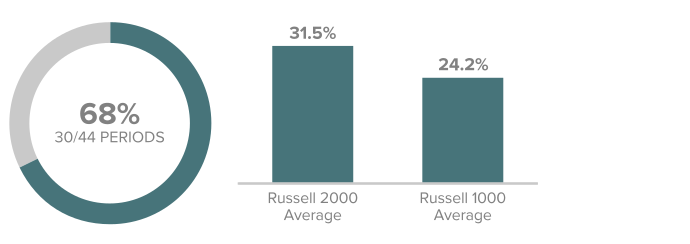
VIX was ≥28% in 44/408 periods. Source: Bloomberg. Past performance is no guarantee of future results. The chart above measures the average returns and spread of the monthly trailing three-year return periods in month where the monthly average three-year VIX level falls within the specified range. The CBOE S&P 500 Volatility Index (VIX) measures market expectations of near-term volatility conveyed by S&P 500 stock index option prices. It is the square root of the risk-neutral expectation of the S&P 500 variance over the next 30 calendar days and is quoted as an annualized standard deviation. The Russell 1000 Index is an unmanaged, capitalization-weighted index of domestic large-cap stocks. It measures the performance of the 1,000 largest publicly traded US companies in the Russell 3000 Index. The Russell 2000 Index is an index of domestic small-cap stocks that measures the performance of the 2,000 smallest publicly traded US companies in the Russell 3000 Index.
In addition, as active investors, we welcome a market environment that distracts investors from longer-term business fundamentals and economic value, which is often the case when markets experience elevated volatility. It allows for even greater distinction between companies that possess higher quality attributes compared to those that don't. As we enter 2025, we remain highly constructive on the backdrop for small-cap equities and for our differentiated and highly active approach to constructing our portfolios.
WHAT ARE THE RISKS?
All investments involve risks, including possible loss of principal. Past performance is no guarantee of future results. Please note that an investor cannot invest directly in an index. Unmanaged index returns do not reflect any fees, expenses or sales charges.
Equity securities are subject to price fluctuation and possible loss of principal.
Commodities and currencies contain heightened risk that include market, political, regulatory, and natural conditions and may not be suitable for all investors.
Small- and mid-cap stocks involve greater risks and volatility than large-cap stocks.
Any data and figures quoted in this article sourced from Russell Investments, FactSet, Bloomberg and Reuters.
Important data provider notices and terms available at www.franklintempletondatasources.com. All data is subject to change.
