

CONTRIBUTORS

Francis Gannon
Co-Chief Investment Officer, Managing Director, Royce Investment Partners
The equity markets hate uncertainty, and we continue to see plenty of headline and policy-driven risk in the near term that will drive market volatility. Yet it will also drive long-term opportunity, especially for an out-of-favor asset class that has been all but forgotten by many investors.”
Trade tensions and signs of a slowing economy are mounting, and as a result it seems as if economic uncertainty is intensifying by the day. Without question, the economic news flow has been disappointing of late, be it sharp declines in consumer sentiment and confidence, higher inflation expectations, falling manufacturing new orders, or the lowest level on record for pending home sales, to name just a few. Throw in the daily barrage of headlines surrounding new tariffs being implemented or delayed/postponed, along with increased corporate and federal layoffs, and we have the perfect recipe for a correction. In fact, the Russell 2000 Index has declined -17.0% from its most recent high on 11/25/24 through 3/10/25. The question remains, will this economic growth scare, or possible recession, alter our belief here at Royce that the market should continue to broaden out?
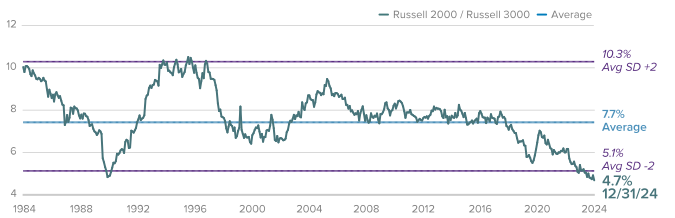
From our perspective, we remain confident that a broadening of the market is at hand. The Russell 2000 was negative over the past four years, with an annualized return of -1.7% from 3/10/21 through 3/10/25, while the Russell 1000 Index has averaged 10.2% over the same period. Smaller companies have been out of favor, and while the uncertainty of today’s headlines are causing markets to reset in the short term, we see several countervailing positive factors that should benefit smaller companies, such as more attractive valuations, strong growth potential, re-shoring, deregulation, and diversification away from the high concentration risk in the large-cap indexes. Adding to all of this is the fact that, at the end of 2024, the Russell 2000 companies together represented only 4.7% of the Russell 3000 Index by market capitalization. You would have to go back to the late 1980s to see a similarly miniscule portion of the Russell 3000 being small caps—the long-term average is closer to 8%.
Small-Cap’s Weight in the Russell 3000 at Historical Low
The Russell 2000’s Total Market Cap as a Percentage of the Russell 3000’s Total Market Cap (%), 11/30/84-12/31/24
Source: FactSet.
At the same time, and following a two-year earnings recession and a better-than-expected earnings season, fourth quarter 2024 earnings seem to suggest that small-cap’s earnings may have bottomed and should lead the market over the next two years.
Average Expected Earnings Growth for 2025-2026
Index Aggregate Estimated Two-Year EPS Growth
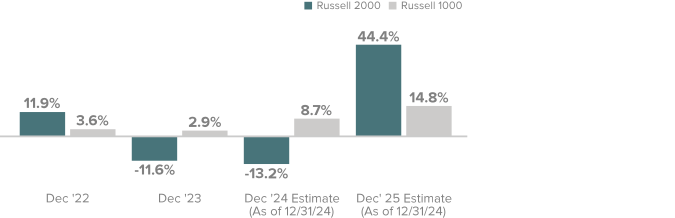
Earnings per share (EPS) is calculated as a company’s profit divided by the outstanding shares of its common stock. The EPS Growth Estimates are the pre-calculated mean one-year EPS growth rate estimates by brokerage analysts. Estimates are the average of those provided by analysts working for brokerage firms who provide research coverage on each individual security as reported by FactSet. All non-equity securities, investment companies, companies without brokerage analyst coverage are excluded. Source: FactSet.
Given the increasing risk of an economic growth scare, whether from tariff tension, a slowing economy, or both, investors are rightfully focused on the potential for decelerating earnings and revenue growth. At the moment, it’s true that earnings expectations have fallen—but not significantly. Obviously, if the economic growth scare becomes a recession this dynamic will change. However, one of the best historical signals of a recession is so far not flashing—credit spreads remain very narrow compared to historical norms.
To be sure, corrections are never enjoyable. They are finite, however, and not all that uncommon. In fact, the average intra-year decline for the Russell 2000 going back to the end of 1999 through the end of 2024 is 20%—while the average annualized calendar year return over the same period was 9.2%. The equity markets hate uncertainty, and we continue to see plenty of headline and policy-driven risk in the near term that will drive market volatility. Yet it will also drive long-term opportunity, especially for an out-of-favor asset class that has been all but forgotten by many investors. Reversion to the mean is a powerful idea, as Ben Graham said, “In the short run, the market is a voting machine but in the long run, it is a weighing machine.” We could not agree more!
Definitions
The Russell 1000 Index is an unmanaged, capitalization-weighted index of domestic large-cap stocks. It measures the performance of the 1,000 largest publicly traded US companies in the Russell 3000 Index.
The Russell 2000 Index is an index of domestic small-cap stocks that measures the performance of the 2,000 smallest publicly traded US companies in the Russell 3000 Index.
The Russell 3000 Index is an unmanaged index of the 3,000 largest US companies.
WHAT ARE THE RISKS?
All investments involve risks, including possible loss of principal. Past performance is no guarantee of future results. Please note that an investor cannot invest directly in an index. Unmanaged index returns do not reflect any fees, expenses or sales charges.
Equity securities are subject to price fluctuation and possible loss of principal.
Commodities and currencies contain heightened risk that include market, political, regulatory, and natural conditions and may not be suitable for all investors.
Small- and mid-cap stocks involve greater risks and volatility than large-cap stocks.
US Treasuries are direct debt obligations issued and backed by the “full faith and credit” of the US government. The US government guarantees the principal and interest payments on US Treasuries when the securities are held to maturity. Unlike US Treasuries, debt securities issued by the federal agencies and instrumentalities and related investments may or may not be backed by the full faith and credit of the US government. Even when the US government guarantees principal and interest payments on securities, this guarantee does not apply to losses resulting from declines in the market value of these securities.
Any companies and/or case studies referenced herein are used solely for illustrative purposes; any investment may or may not be currently held by any portfolio advised by Franklin Templeton. The information provided is not a recommendation or individual investment advice for any particular security, strategy, or investment product and is not an indication of the trading intent of any Franklin Templeton managed portfolio. Past performance does not guarantee future results.
Any data and figures quoted in this article sourced from Russell Investments, FactSet, Bloomberg and Reuters.
Important data provider notices and terms available at www.franklintempletondatasources.com. All data is subject to change.
