

CONTRIBUTORS

Francis Gannon
Co-Chief Investment Officer, Managing Director, Royce Investment Partners

Chris Clark
Chief Executive Officer, Co-Chief Investment Officer & President, RFS
These are difficult days.
The Russell 2000 Index fell -9.5% in 1Q25—and declined 9.6% for the week ended 4/4/25—which was one of the 20 worst weekly performances for the small-cap index since its inception on 12/31/78. And yet, while it was undoubtedly a precipitous drop, it still didn’t crack the top ten worst weeks that small-caps have endured over that 45-year+ time span.
The upshot was a loss of 18.5% for the Russell 2000 year-to-date through 4/7/25. Moreover, from its 11/25/24 peak through 4/7/25, the Russell 2000 fell -25.5% (and lost -22.1% from its previous peak on 11/8/21). Uncertainty over US political, trade and, monetary policies—along with the fear that there could be a sizable negative impact on economic growth and the possibility of a recession or stagflation—are weighing heavily on equities. To be sure, we’re seeing an even sharper increase in concerns about economic growth in the brief aftermath of the widespread tariff announcement on 4/2/25.
Regardless of market cap, we expect tariffs to keep stock prices mostly moving lower for as long as the outlook for the US economy remains shaky. Much of this anxiety was initially driven by a “now you see it, now you don’t” approach to implementation. We think that if tariffs are used as a tool for negotiating more advantageous trade relationships, then an ultimately positive endpoint can be seen—but from our current vantage point here in early April, it seems clear that any long-range goals are unlikely to be reached without a measure of economic pain. How much and for how long cannot be determined right now. Given the tumult, it’s not surprising that many of the positive trends we’d been seeing, such as re-shoring, deglobalization, and deregulation, have fallen off the radar.
In previous years, when worries about long-term growth have accelerated market downturns, small-caps were usually hit the hardest. They’ve often been the risk asset investors sell first when there’s an even greater sense of economic uncertainty. Even in that context, however, the speed and severity of the current downturn were surprising. And with the current policy uncertainty, we think that the markets will be even more volatile going forward as investors race to reposition their portfolios in reaction to each new, and at times contradictory, headline.
It’s a challenging exercise during the best of times, but as we look through the noise and think about the long run, we see many small-cap companies with excellent fundamentals and/or strong prospects for long-term growth or recovery that are also selling at attractive prices. To be sure, our investment teams are busy searching for promising bargains, knowing that many investors are not looking at financial and operational fundamentals and/or don’t have long-term investment horizons similar to our own.
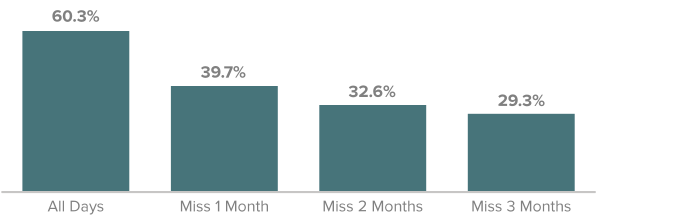
Our belief has always been that people should stay invested and buy during down markets, especially when the losses come in double digits, irrespective of what’s happening in the short term. Bear markets present an opportune chance to use dollar cost averaging to buy shares on the cheap. So, while we certainly understand that psychology makes it hard to invest when markets are struggling, history clearly shows that panic selling or staying on the sidelines during downturns can be costly over the long run.
Missing the Rally’s Earliest Stage Has Been Costly
Average 12 Month Returns for the Russell 2000 During a Recovery Depending on Various Entry Points, 10/5/79-3/31/25
Source: Russell Investments. Past performance is no guarantee of future results.
We have always believed that staying invested during downturns is one of the most important ingredients in the long-term success of any active investment approach in the equity universe, regardless of style or market cap. As challenging as the current environment is, we welcome times like this because of the long-term opportunities they present.
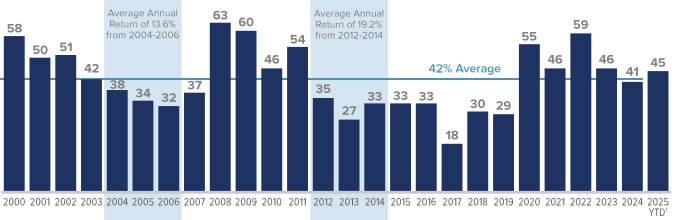
It’s also true that volatile markets have historically offered seeding ground for higher-than-average subsequent returns. We went back 25 years and looked at 3-year returns and tracked trading days when the Russell 2000 rose or fell 1% or more on a single trading day. We found that when small-caps came out of a less volatile period from 2004-2006, the Russell 2000 had a 13.6% average annual total return. However, coming out of a more volatile period from 2012-2014, the small-cap index had an average annual total return of 19.2%.
Small-Caps Generally Have Strong Three-Year Returns After Periods of High Volatility
Percentage of Trading Days with Moves of 1% or More in the Russell 2000 Over the Last 25 Years from 3/31/00- 3/31/25
Source: Russell Investments. Past performance is no guarantee of future results. 1The average percentage does not include 2025 YTD data.
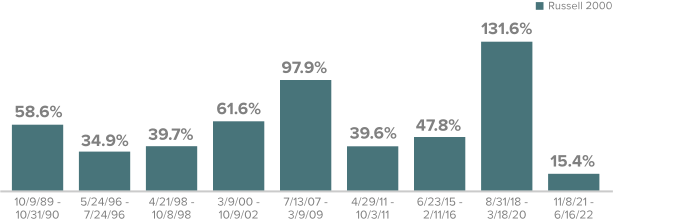
We also examined previous bear markets to see how small-caps fared in the subsequent recovery. The encouraging one-year results are shown in the chart below.
Small-Cap Strength Following Bear Markets
One-Year Returns from Small-Cap Market Troughs of the Last 36 Years
Source: Russell Investments. Past performance is no guarantee of future results.
One critical advantage to having been small-cap specialists for more than 50 years is how comfortable we are investing through corrections and bear markets. We have always sought to act on the idea of being greedy when others are fearful and fearful when others are greedy. That idea is more important than ever during these uncertain days.
Definitions
The Russell 2000 Index is an index of domestic small-cap stocks that measures the performance of the 2,000 smallest publicly traded US companies in the Russell 3000 Index. Indexes are unmanaged and one cannot invest directly in an index. Important data provider notices and terms available at www.franklintempletondatasources.com.
WHAT ARE THE RISKS?
All investments involve risks, including possible loss of principal. Past performance is no guarantee of future results. Please note that an investor cannot invest directly in an index. Unmanaged index returns do not reflect any fees, expenses or sales charges.
Equity securities are subject to price fluctuation and possible loss of principal.
Commodities and currencies contain heightened risk that include market, political, regulatory, and natural conditions and may not be suitable for all investors.
Small- and mid-cap stocks involve greater risks and volatility than large-cap stocks.
US Treasuries are direct debt obligations issued and backed by the “full faith and credit” of the US government. The US government guarantees the principal and interest payments on US Treasuries when the securities are held to maturity. Unlike US Treasuries, debt securities issued by the federal agencies and instrumentalities and related investments may or may not be backed by the full faith and credit of the US government. Even when the US government guarantees principal and interest payments on securities, this guarantee does not apply to losses resulting from declines in the market value of these securities.
Active management does not ensure gains or protect against market declines.
Any companies and/or case studies referenced herein are used solely for illustrative purposes; any investment may or may not be currently held by any portfolio advised by Franklin Templeton. The information provided is not a recommendation or individual investment advice for any particular security, strategy, or investment product and is not an indication of the trading intent of any Franklin Templeton managed portfolio. Past performance does not guarantee future results.
Any data and figures quoted in this article sourced from Russell Investments, FactSet, Bloomberg and Reuters.
Important data provider notices and terms available at www.franklintempletondatasources.com. All data is subject to change.
